

The air quality index (AQI) is a single number, running from 0 to 500 in India, that summarises how clean or polluted the air is at a given place and time, and it is divided into six colour-coded categories from Good to Severe. It lets anyone judge in seconds whether the air outside is safe to breathe without reading raw pollutant readings.
India’s official air quality index is run by the Central Pollution Control Board (CPCB), which launched the National Air Quality Index in 2014. Last updated: 2 November 2026. This explainer covers what the index measures, how the number is worked out, what each category means for health, why Delhi and the Indo-Gangetic Plain top the charts every winter, and how the index is used in policy and in daily life.
| Attribute | Detail |
|---|---|
| Full name | National Air Quality Index (AQI), India |
| Run by | Central Pollution Control Board (CPCB), under the Ministry of Environment, Forest and Climate Change |
| Launched | 2014, in the Swachh Bharat campaign |
| Scale | 0 to 500, in six categories |
| Categories | Good, Satisfactory, Moderately Polluted, Poor, Very Poor, Severe |
| Pollutants covered | PM10, PM2.5, nitrogen dioxide, sulphur dioxide, carbon monoxide, ozone, ammonia and lead |
| How the final number is set | The highest sub-index among the measured pollutants decides the AQI |
| Related tools | CPCB Sameer app, SAFAR forecasts, Graded Response Action Plan (GRAP) |
Key Takeaways
- The air quality index is a 0 to 500 number that converts several pollutant readings into one easy figure and a colour-coded category.
- India’s AQI has six categories: Good (0 to 50), Satisfactory (51 to 100), Moderately Polluted (101 to 200), Poor (201 to 300), Very Poor (301 to 400) and Severe (401 to 500).
- The AQI is set by the single worst pollutant, so a city can be rated Severe because of fine particles alone even if every other gas is within safe limits.
- PM2.5, the fine particles smaller than 2.5 micrometres, are the pollutant that most often drives the AQI up in Indian cities and carry the largest health risk.
- Delhi’s winter spike comes from a combination of crop-residue burning, vehicle and industrial emissions, firecrackers, cold air that traps pollution near the ground and very low wind speeds.
- The AQI is not just a display number, because it triggers action plans such as the Graded Response Action Plan (GRAP) in the Delhi region.
What is the air quality index?
The air quality index is a standard scale that turns measurements of several air pollutants into one number and one colour, so that the general public can understand air quality at a glance. Without an index, a citizen would have to compare separate readings for particles and gases, each with its own unit and its own safe limit.
The idea is similar to the way a weather forecast turns many variables into a simple “hot” or “mild”. The AQI takes the concentration of each pollutant, compares it with national standards and health thresholds, and rescales it to a common 0 to 500 range. The higher the number, the greater the health concern.
The index is calculated for a monitoring station and then often averaged or reported for a city. It describes the air at the moment or over the past 24 hours, so it can change within hours when the wind shifts, traffic builds up or a fire starts nearby.
How did India’s air quality index begin?
India’s National Air Quality Index was launched in 2014, replacing a patchwork of older, hard-to-read pollutant tables with one national system. It was developed by the CPCB with expert groups and IIT Kanpur, and announced by the environment ministry as part of the Swachh Bharat drive.
Before 2014, the public mostly saw raw numbers in technical reports, and different agencies described pollution in different ways. The national index aimed to give the same message in every state. It also added a health message for each category so that people would know what to do rather than only what the number was.
Earlier air-quality monitoring in India dates back to the 1980s, but the arrival of continuous, real-time monitors in the 2010s made a live index practical. Today the CPCB publishes a daily national bulletin and hourly readings for hundreds of stations, and city and state boards publish their own dashboards.
What are the six AQI categories and what do they mean?
India’s AQI has six categories, Good, Satisfactory, Moderately Polluted, Poor, Very Poor and Severe, and each carries a colour and a health message that gets more serious as the number rises. The table below sets them out.
| AQI range | Category | Typical health message |
|---|---|---|
| 0 to 50 | Good | Minimal impact on health |
| 51 to 100 | Satisfactory | Minor breathing discomfort for sensitive people |
| 101 to 200 | Moderately Polluted | Breathing discomfort for people with lung disease, asthma and heart disease |
| 201 to 300 | Poor | Discomfort for most people on prolonged exposure |
| 301 to 400 | Very Poor | Respiratory illness on prolonged exposure |
| 401 to 500 | Severe | Affects healthy people and seriously affects those with existing disease |
The colours run from green for Good to dark red or maroon for Severe. Sensitive groups, namely children, older adults, pregnant women and people with asthma, heart or lung conditions, feel the effect at lower levels than healthy adults, which is why they are advised to take precautions earlier.
Readings above 500 are possible during extreme episodes, but the official scale stops at 500, so such conditions are reported as 500 or described as “beyond the index”.
Which pollutants does the AQI measure?
India’s AQI can include up to eight pollutants: PM10, PM2.5, nitrogen dioxide (NO2), sulphur dioxide (SO2), carbon monoxide (CO), ozone (O3), ammonia (NH3) and lead (Pb). In practice most stations report only a subset, and the particles usually decide the final number.
- PM2.5: particles smaller than 2.5 micrometres, about one-thirtieth the width of a human hair, which can reach deep into the lungs and enter the bloodstream. They come from vehicle exhaust, burning of crops and waste, coal power and industry, and from gases that react in the air.
- PM10: coarser particles up to 10 micrometres, often road dust, construction dust and soil, which irritate the nose, throat and airways.
- Nitrogen dioxide: a gas from burning fuel in engines and power plants, linked to airway inflammation and the formation of ozone and particles.
- Sulphur dioxide: a gas from burning coal and some industrial processes, which irritates the lungs and forms fine particles.
- Carbon monoxide: a colourless gas from incomplete burning that reduces the blood’s ability to carry oxygen.
- Ozone: a gas formed when sunlight reacts with other pollutants, which is a lung irritant at ground level and tends to peak on hot, sunny afternoons.
- Ammonia and lead: included in the index, though measured at fewer stations and rarely the deciding pollutant.
How is the AQI calculated?
The AQI is calculated by converting each pollutant’s concentration into a sub-index on the 0 to 500 scale and then taking the highest sub-index as the overall AQI. This “worst pollutant wins” rule is called the maximum operator method.
The steps are straightforward. First, a station records the concentration of each pollutant, using a 24-hour average for most pollutants and an 8-hour average for carbon monoxide and ozone. Second, each concentration is placed within a band, called a breakpoint range, and converted to a sub-index by a linear formula. Third, the highest sub-index becomes the AQI, and the pollutant behind it is named the prominent pollutant.
For a valid reading, a station must report at least three pollutants, and at least one of them must be PM2.5 or PM10. Where data are missing for long stretches, the index is not computed. This protects against false readings, though it also explains why some stations show gaps.
A short example shows how this works. If PM2.5 gives a sub-index of 320, PM10 gives 260 and ozone gives 90, the AQI is 320, which is Very Poor, and PM2.5 is the prominent pollutant. The cleaner readings for the other pollutants do not pull the number down.
Where does India’s AQI data come from?
India’s AQI data come mainly from a national network of continuous ambient air quality monitoring stations run by the CPCB and state pollution control boards, supplemented by manual stations and by the SAFAR system in a few cities. Together they cover several hundred locations, though most are in cities.
Continuous stations use instruments that measure particles and gases every few minutes and send data to a central server. The CPCB’s public dashboard and its Sameer mobile app show these readings live, along with a 24-hour average AQI and the prominent pollutant.
SAFAR, the System of Air Quality and Weather Forecasting and Research, was developed by the Indian Institute of Tropical Meteorology, Pune, and the India Meteorological Department under the Ministry of Earth Sciences. It began with the 2010 Commonwealth Games in Delhi and now provides forecasts in cities including Delhi, Mumbai, Pune and Ahmedabad.
Coverage remains uneven. Rural India, where cooking fires and crop burning are major sources, has few monitors, so large parts of the country are covered by satellite estimates and models rather than by ground readings. Low-cost sensors operated by researchers and citizen groups are helping fill gaps, although they usually need calibration against reference instruments.
How does India’s AQI differ from the US AQI and WHO guidelines?
India’s AQI differs from the US AQI in its category thresholds, its number of pollutants and its health messages, and both differ from the World Health Organization’s guideline values, which are stricter than either index. As a result, the same pollution can score differently on different apps.
The US AQI also runs from 0 to 500 but has different breakpoints, so a given PM2.5 level generally scores a higher AQI on the US scale than on India’s, especially at moderate levels. International apps often show the US figure, which is why a number on a foreign website can disagree with the CPCB figure for the same city.
The reference points behind the indices also differ. India’s National Ambient Air Quality Standards set limits for PM2.5 at 40 micrograms per cubic metre as an annual average and 60 as a 24-hour average. The WHO’s 2021 guidelines recommend an annual average of only 5 micrograms per cubic metre for PM2.5, and a 24-hour limit of 15, so almost every Indian city exceeds them.
The simplest way to avoid confusion is to pick one source, such as the CPCB or SAFAR, and compare like with like. For health decisions, remember that even an Indian “Satisfactory” day can contain more fine particles than the WHO recommends.
Why does Delhi’s air quality spike every winter?
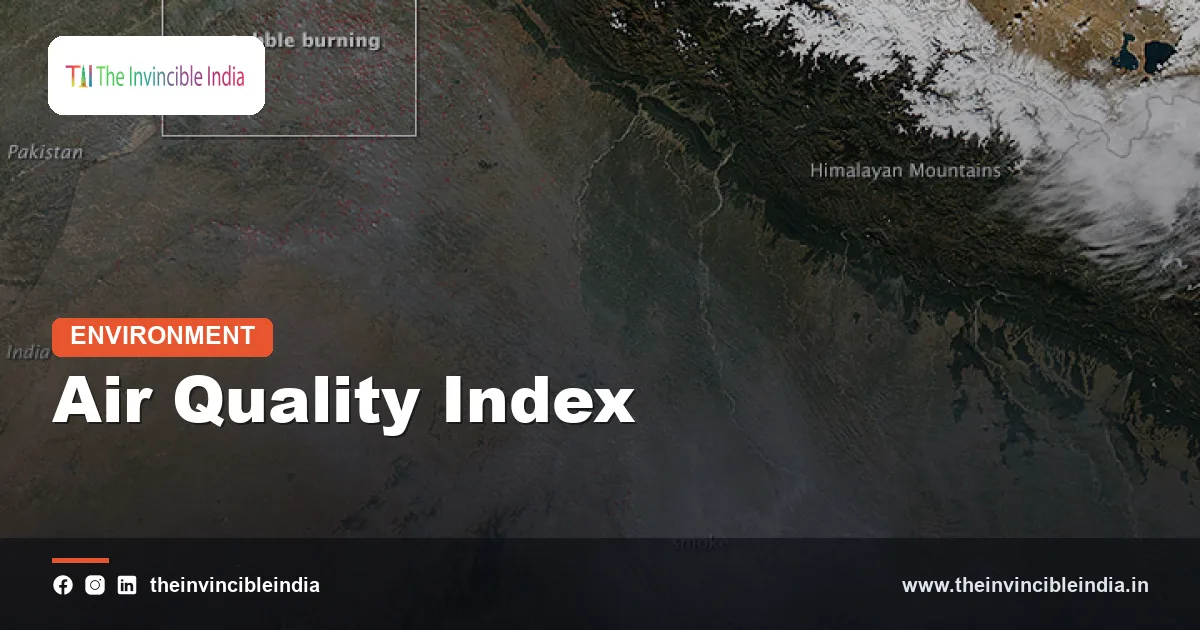
Delhi’s air quality spikes every winter because local emissions pile up under cold, still air while smoke from crop-residue burning in neighbouring states adds to the load. The result is a regular run of Very Poor and Severe days between roughly October and January.
Several factors combine.
- Temperature inversion: in winter, a layer of warm air sits above cold air near the ground and acts like a lid, so pollutants cannot rise and disperse.
- Low wind: weak winds stop pollution from being carried away, and the Indo-Gangetic Plain’s flat terrain and the Himalayas to the north make it a natural basin for trapped air.
- Crop-residue burning: farmers in Punjab, Haryana and nearby areas burn paddy stubble to clear fields quickly before wheat sowing, and smoke drifts towards Delhi in October and November.
- Local sources: vehicles, construction and road dust, industries, power plants, waste burning and the use of fuel for heating and cooking all keep adding fine particles.
- Festival emissions: fireworks around Diwali add a short, sharp burst of particles and metals, even where bans are in force.
- Secondary particles: gases such as ammonia, nitrogen oxides and sulphur dioxide react in cool, humid air to form fine particles, which can make up a large share of PM2.5.
The share of each source varies by day and by study, which is why scientists caution against blaming only one cause. Crop burning matters most for a few weeks, while vehicles, dust and industry matter all year round.
How is the AQI used in policy and action plans?
The AQI is used as a trigger and a yardstick for official action, most visibly through the Graded Response Action Plan (GRAP) in the Delhi National Capital Region and through the National Clean Air Programme (NCAP). It turns the daily number into rules about what may and may not be done.
Under GRAP, the Commission for Air Quality Management (CAQM) in the National Capital Region and Adjoining Areas, set up in 2021, imposes measures in stages as the AQI worsens. The stages are broadly linked to the Poor, Very Poor, Severe and Severe-plus categories, and the measures become stricter at each step.
- Early stages focus on dust control, stricter checks on polluting vehicles, curbs on diesel generator sets and wider public warnings.
- Middle stages add measures such as limits on some construction work, parking fees and more public transport.
- The most severe stages can bring restrictions on trucks, a halt to many construction and demolition activities and work-from-home or school-closure orders.
NCAP, launched in 2019, set targets to cut particle pollution in a list of more than 100 “non-attainment” cities that repeatedly fail the national standards. It funds measures such as road dust control, cleaner public transport and monitoring. Progress is tracked partly by the same AQI and PM readings, although critics argue that targets and data coverage need strengthening.
What can you do when the AQI is high?
When the AQI is high, you should reduce your exposure by limiting outdoor exertion, keeping windows closed during peak pollution hours and using a well-fitted mask or a clean-air room if possible. The right steps depend on the category.
| Category | Sensible steps |
|---|---|
| Good or Satisfactory | Normal activity for most people; sensitive people watch for symptoms |
| Moderately Polluted | Sensitive groups reduce long or heavy outdoor exercise |
| Poor | Everyone avoids prolonged outdoor exertion; use a mask outdoors |
| Very Poor | Limit outdoor time; exercise indoors; children and older adults stay in |
| Severe | Avoid outdoor activity; keep windows shut; use air purifiers if available; seek care if symptoms appear |
A well-fitted N95 or equivalent respirator filters most fine particles, whereas thin cloth or surgical masks give much less protection. Air purifiers with HEPA filters can reduce indoor particle levels, but they only work in a closed room, and they are costly for many households.
Individual action only reduces the harm, because the real fix is cleaner air for everyone. That means fewer emissions from vehicles, industry, power plants, waste burning and farm fires, along with better public transport and clean cooking fuels in homes.
What are the limits of the AQI?
The AQI has several limits: it describes the air at one place, it hides which pollutant is the worst unless you look further, and it says little about long-term exposure. A city can have a Moderate day and still carry a heavy yearly burden of fine particles.
Because it uses the maximum rule, the AQI also reflects only one pollutant at a time, though the combined effect of several pollutants may be worse than any single one. It also depends on where the station sits, and a monitor next to a busy road will read higher than one in a park a kilometre away.
Finally, indoor air, which can be badly polluted by cooking smoke, incense, mosquito coils and tobacco, is not captured by outdoor indices at all. In many rural homes burning biomass, indoor exposure is a larger health risk than the outdoor AQI would suggest.
Bottom Line
The air quality index is India’s simple, colour-coded way of saying how safe the air is, built on the worst of up to eight pollutants and rated from Good to Severe. It matters because Indian cities, especially across the Indo-Gangetic Plain, often sit in the Poor to Severe range, and fine particles are linked to heart and lung disease. Reading the AQI, knowing which pollutant is driving it and acting on its health advice are small steps, but cleaner air ultimately depends on cutting emissions at the source.
Frequently Asked Questions
What is a good AQI in India?
An AQI of 0 to 50 is rated Good in India, and 51 to 100 is Satisfactory. Within these two bands the air poses little or no risk to most people, though sensitive individuals may feel minor discomfort at the upper end of Satisfactory.
How is the AQI calculated in India?
The AQI is calculated by converting each pollutant’s concentration into a sub-index on a 0 to 500 scale and taking the highest one as the overall AQI. A station needs data on at least three pollutants, including PM2.5 or PM10, for the index to be valid.
Which pollutants are included in India’s AQI?
India’s AQI can include eight pollutants: PM10, PM2.5, nitrogen dioxide, sulphur dioxide, carbon monoxide, ozone, ammonia and lead. Most stations report a subset, and PM2.5 or PM10 usually sets the final value.
Why is Delhi’s AQI so high in winter?
Delhi’s AQI rises in winter because cold, still air and temperature inversion trap pollution near the ground. Local emissions from vehicles, dust and industry combine with smoke from stubble burning and Diwali fireworks to push readings into the Very Poor and Severe range.
Why does the AQI on my phone differ from the CPCB figure?
The AQI on a phone app can differ because apps may use the US AQI scale, different monitoring stations or a different averaging period. India’s CPCB index uses its own breakpoints and a 24-hour average, so the numbers will rarely match exactly.
What does an AQI above 400 mean?
An AQI of 401 to 500 is classed as Severe and affects even healthy people, with serious risk for those with heart or lung disease. Outdoor exertion should be avoided, and authorities may put emergency measures under GRAP into effect in the Delhi region.
{“@context”:”https://schema.org”,”@graph”:[{“@type”:”FAQPage”,”mainEntity”:[{“@type”:”Question”,”name”:”What is a good AQI in India?”,”acceptedAnswer”:{“@type”:”Answer”,”text”:”An AQI of 0 to 50 is rated Good in India, and 51 to 100 is Satisfactory. Within these two bands the air poses little or no risk to most people, though sensitive individuals may feel minor discomfort at the upper end of Satisfactory.”}},{“@type”:”Question”,”name”:”How is the AQI calculated in India?”,”acceptedAnswer”:{“@type”:”Answer”,”text”:”The AQI is calculated by converting each pollutant’s concentration into a sub-index on a 0 to 500 scale and taking the highest one as the overall AQI. A station needs data on at least three pollutants, including PM2.5 or PM10, for the index to be valid.”}},{“@type”:”Question”,”name”:”Which pollutants are included in India’s AQI?”,”acceptedAnswer”:{“@type”:”Answer”,”text”:”India’s AQI can include eight pollutants: PM10, PM2.5, nitrogen dioxide, sulphur dioxide, carbon monoxide, ozone, ammonia and lead. Most stations report a subset, and PM2.5 or PM10 usually sets the final value.”}},{“@type”:”Question”,”name”:”Why is Delhi’s AQI so high in winter?”,”acceptedAnswer”:{“@type”:”Answer”,”text”:”Delhi’s AQI rises in winter because cold, still air and temperature inversion trap pollution near the ground. Local emissions from vehicles, dust and industry combine with smoke from stubble burning and Diwali fireworks to push readings into the Very Poor and Severe range.”}},{“@type”:”Question”,”name”:”Why does the AQI on my phone differ from the CPCB figure?”,”acceptedAnswer”:{“@type”:”Answer”,”text”:”The AQI on a phone app can differ because apps may use the US AQI scale, different monitoring stations or a different averaging period. India’s CPCB index uses its own breakpoints and a 24-hour average, so the numbers will rarely match exactly.”}},{“@type”:”Question”,”name”:”What does an AQI above 400 mean?”,”acceptedAnswer”:{“@type”:”Answer”,”text”:”An AQI of 401 to 500 is classed as Severe and affects even healthy people, with serious risk for those with heart or lung disease. Outdoor exertion should be avoided, and authorities may put emergency measures under GRAP into effect in the Delhi region.”}}]}]}